Big Data Tools for Data Analysis
Big Data Tools for Data Analysis
Data Extraction Tools
- Octoparse (https://www.octoparse.com)
Octoparse is a simple and intuitive web crawler for data extraction from many websites without coding. You can use it both on your Windows devices and Mac OS system. Whether you are a first-time self-starter, experienced expert or business owner, it will satisfy your needs with its enterprise-class service. To eliminate the difficulties of setting up and using, Octoparse adds “Task Templates” covering over 30 websites for starters to grow comfortable with the software. They allow users to capture the data without task configuration. For seasoned pros, “Advanced Mode” helps you extract Enterprise volume data within minutes. Besides, you can set up Scheduled Cloud Extraction which enables you to obtain dynamic data in real-time and keep a tracking record. Start your Free Trial Now!
- Content Grabber (https://www.mozenda.com)
Content Graber is a web crawling software for advanced extraction. It has a programming operation environment for development, testing, and production servers. You can use C# or VB.NET to debug or write scripts to control the crawler. It also allows you to add third-party extensions on top of your crawler. With comprehensive capabilities, Content Grabber is exceedingly powerful to users with basic tech knowledge.
- Import.io (https://www.import.io)
Import.io is a web-based data extraction tool. It first launched in London. Now, import.io shift its business model from B2C to B2B. In 2019, Import.io purchased Connotate and become a Web Data Integration Platform. With extensive web data service, Import.io is an excellent choice for business analytics.
- Parsehub (https://www.parsehub.com/blog/)
Parsehub is a web-based crawler. It can extract data handle dynamic websites with AJax, JavaScripts, and behind the login. It has a one-week free-trial window for users to experience its functionalities.
- Mozenda (https://www.mozenda.com)
Mozenda is a web scraping software that also provides scraping service for business-level data extraction. It can extract scalable data both from Cloud-hosted and on-premise software.
Part 2: Open Source Data tools
- 1. Knime
KNIME Analytics Platform is an analytic platform. It can help you to discover business insights and full potential within the markets. It provides Eclipse Platform along with other external extensions for data mining and machine learning. It gives over 2k modules for analytic professionals ready to deploy.
- 2. OpenRefine
OpenRefine (formerly Google Refine) is a powerful tool to work with messy data: cleaning, transforming, and dataset linking. With its group features, you can normalize the data at ease.
- 3. R-Programming
It’s a free software programming language and software environment for statistical computing and graphics. The R language is popular among data miners for developing statistical software and data analysis. It gains credits and popularities in recent years due to the ease of use and extensive functionalities.
Besides data mining, it also provides statistical and graphical techniques, linear and nonlinear modeling, classical statistical tests, time-series analysis, classification, clustering, and more.
- 4. RapidMiner
Much like KNIME, RapidMiner operates through visual programming and is capable of manipulating, analyzing, and modeling. It increases data work productivity through an open-source platform, machine learning, and model deployment. The unified data science platform accelerates the analytical workflows from data prep to implementation. It dramatically improves efficiency.
- 5. Pentaho
It is a great business intelligence software that helps companies to make data-driven decisions. As most companies have difficulties in getting value from the data. The platform integrates data sources, including the local database, Hadoop, and NoSQL. As a result, you can analyze and manage the data at ease.
- 6. Talend
It is an open-source integration software designed to turn data into insights. It provides various services and software, including cloud storage, enterprise application integration, data management, etc. Backed by a vast community, it allows all Talend users and members to share information, experiences, doubts from any location.
- 7. Weka
Weka is a collection of machine learning algorithms for data mining tasks. The algorithms can either be applied directly to a data set or called from your own JAVA code. It is also well suited for developing new machine learning schemes. With GUI, it translates the world of Data Science to professionals who are lack proficiencies in programming.
- 8. NodeXL
It is an open-source software package for Microsoft Excel. As an add-on extension, it doesn’t have data integration services and functionalities. It focuses on social network analysis. The intuitive networks and descriptive relationships make social media analysis at ease. As one of the best statistical tools for data analysis, it includes advanced network metrics, access to social media network data importers, and automation.
- 9. Gephi
Gephi is also an open-source network analysis and visualization software package written in Java on the NetBeans platform. Think of the giant friendship maps you see that represent LinkedIn or Facebook connections. Gephi takes that a step further by providing exact calculations.
Part 3: Data Visualization
- 1. PowerBI
Microsoft PowerBI has both on-premise and in-cloud service. It first was introduced as an Excel add-on. Soon later, PowerBI gains its popularity with its powerful functionalities. As of now, it is perceived as a leader in Analytics. It provides data visualization and business intelligence features that allow users to creative innovative reports and dashboards at ease with lower cost.
- 2. Solver
Solver specializes a Corporate Performance Management (CPM) software. Its software BI360 is available for cloud and on-premise deployment, which focuses on four key analytics areas including financial reporting, budgeting, and dashboards and data warehouse
- 3. Qlik
Qlik is a self-served data analysis and visualization tool. The visualized dashboards, which help the company “understand” business performance at ease.
- 4. Tableau Public
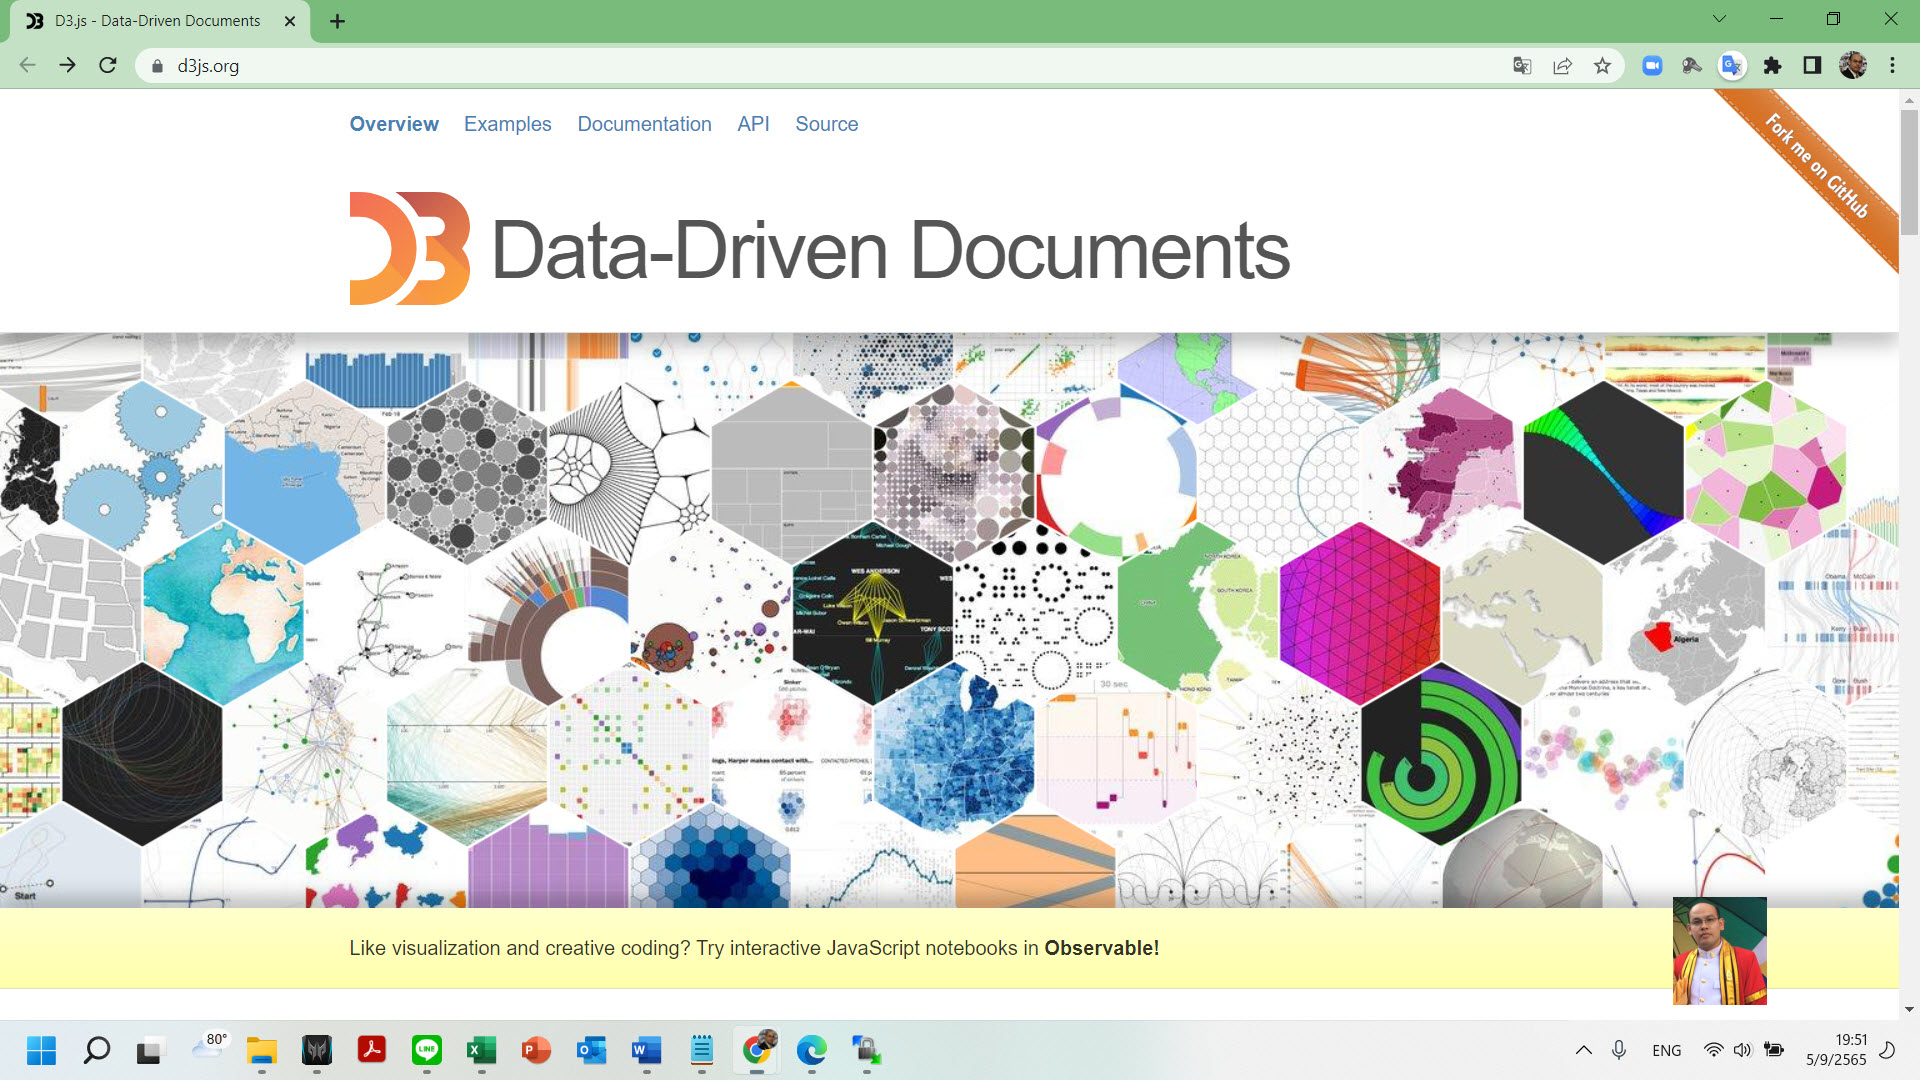
Tableau is an interactive data visualization tool. “Unlike” most visualization tools that require scripting. Tableau helps novice “surmount” the difficulties to get hands-on. The drag and drop features make data analysis at ease. They also have a “starter kit” and rich training source to help users to create innovative reports.
- 5. Google Fusion Tables
Fusion Table is a data management platform provided by Google. You can use it to gather, visualize, and share the data. It is like a spreadsheet, but much more powerful and professional. You can collaborate with colleges by adding your dataset from CSV, KML, and spreadsheets. You also can publish your data work and embed it into other web properties.
- 6. Infogram
Infogram provides over 35 interactive charts and more than 500 maps to help you visualize the data. Along with a variety of charts, including column, bar, pie, or word cloud, it is not hard to impress your audience with innovative infographics.
Part 4: Sentiment Analysis
- 1. HubSpot’s ServiceHub
It has a customer feedback tool that collects customers’ feedbacks and reviews. Then they analyze the languages using NLP to clarify the positive and negative intentions. It visualizes the results with graphs and charts on the dashboards. Besides, you can connect HubSpot’s ServiceHub to the CRM system. As a result, you can relate the survey results with a specific contact. As such, you can identify unhappy customers and provide quality service in time to increase customer retention.
- 2. Semantria
Semantria is a tool that can collect posts, tweets, and comments from social media channels. It uses natural language processing to parse the text and analyzes customers’ attitude. This way, companies can gain actionable insights and come up with better ideas to improve your products and service.
- 3. Trackur
Trackur’s social media monitoring tool which can track the mentions from different sources. It scraps tons of webpages, including videos, blogs, forums, and images to search for relevant messages. You can guard your reputation with its sophisticated functionality. Please don’t bother to make cold calls or email pitch letters, and you still can listen to the voice of your customers’ regards to our brand and products.
- 4. SAS Sentiment Analysis
SAS sentiment analysis is a comprehensive software. For most challenging part of web text analysis is misspelling. SAS can proofread and conduct clustering analysis at ease. With its rule-based Natural Language Processing, SAS grades and categories the messages efficiently.
- 5. Hootsuit Insight
It can analyze comments, posts, forums, news sites, and other over 10M sources across over 50 languages. Besides, it can categorize genders and locations. This allows you to make strategic marketing plans target specific groups. You also can access real-time data and check out the online conversation.
Part 5: Open Source Database
- 1. Oracle
There is no doubt that Oracle is the champion amongst the open-source database. With numbers of features, it is the best choice for the enterprise. It also supports the integration of different platforms. The ease of set up in AWS makes it a reliable option for the Relational Database. The high security to integrate private data such as credit cards makes it irreplaceable.
- 2.PostgreSQL
It surpasses Oracle, MySQL, Microsoft SQL Server and becomes the fourth most popular database. With its rock-solid stability, it can handle a high load of data.
- 3. Airtable
It is a cloud-based database software that has extensive capabilities of a data table for capturing and information display. I also have a spreadsheet and a built-in calendar to track tasks at ease. It easy to get hands-on with its starter templates on lead management, bug tracking, and applicant tracking.
- 4. MariaDB
It is a free, open-source database for data storage, insertion, modification, and retrieval. Also, Maria is backed by a strong community with active members to share information and knowledge.
- 5. Improvado
Improvad is a tool built for marketers to get all their data into one place, in real-time, with automated dashboards and reports. You can choose to view your data inside the Improvado dashboard or pipe it into a data warehouse or visualization tool of your choice like Tableau, Looker, Excel, etc. Brands, agencies, and universities all love using Improvado because it saves them thousands of hours of manual reporting time and millions of dollars in marketing.
—
Source:
– https://www.octoparse.com/blog/top-30-big-data-tools-for-data-analysis


